How to write your detailed paragraphs in writing task 1


This article will explain how you write your paragraph 3 and 4 in writing task 1. Paragraph 3 and 4 is where you identify key features. Make sure to read the first part of how to answer task 1.
When looking at the data and eventually discussing it, it’s important to be open minded. Having a pre-conditioned idea of what you should be looking for won’t serve you well in your exam. Take the data for what it is and approach it with an open mind. If you go in with a formula or short cuts you may have learnt elsewhere, this can go against you and cause you to miss out on things that are quite literally, staring you in the face.
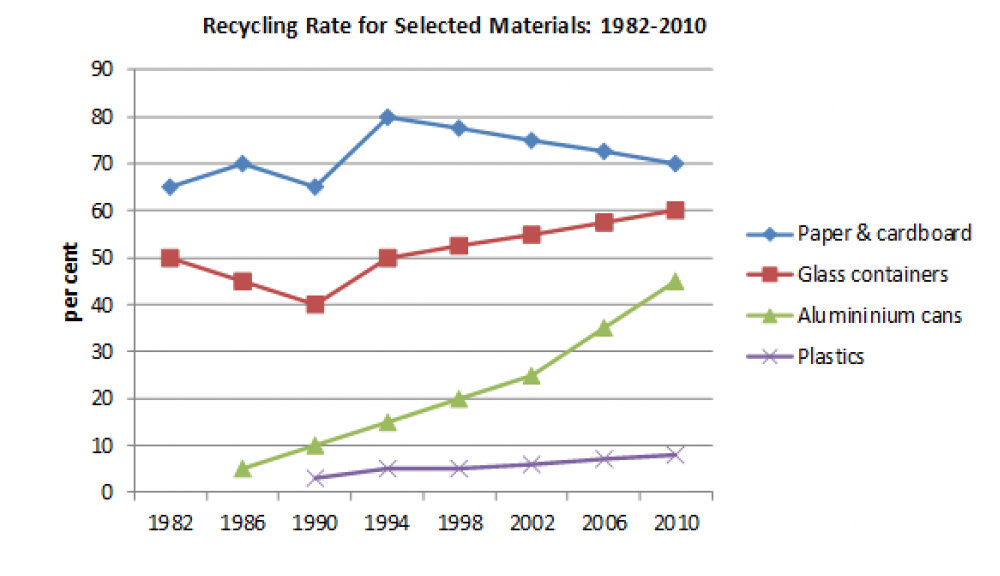
The graph represents the proportion of four contrasting materials that were recycled between 1982 and 2010 for a particular country.
Overall, plastic has the lowest rate of recycling although it appears to be on a slow increase. Aluminium cans have been represented with a positive trajectory, as they continue to increase over time. Glass containers as another recyclable material, despite its dip in the 1990’s, is set to continue its growth. Paper and cardboard seem to have the most early success, though begin to take a decline in the mid 1990’s.
Paragraph 3
At the start of the dates provided, we can see that glass containers and paper and cardboard were at a much higher percentage than that of aluminium and plastic. Paper and cardboard sits at the highest percentage with 65% of people recycling these materials. In this year, there is no evidence presented where people are recycling the remaining materials. As time progresses and we move into 1986 there are some significant changes. Paper and cardboard has risen, glass containers have contrastingly dropped and aluminium cans are beginning to be recycled. By 1990 the recycling of both paper and cardboard, and glass containers have plummeted whilst aluminium is slowly on an upward trajectory. At the middle point of our data in terms of its quarterly review, paper and cardboard have spiked back up with a large recycling increase, glass containers have also increased though at a steadier rate. The recycling of plastics has barely changed whilst aluminium cans continue to soar upward with more and more people recycling this material.
Paragraph 4
By the latter half of the years shown, plastics have roughly remained the same with signs of growth in the remaining years. Clearly, the recycling of plastic has not been as successful as the other materials. Contrastingly, aluminium cans take on a much healthier progression and show continuous signs of growth over the years. We can see that from 1990 glass containers took a significant climb where we can deduce the rising success of people recycling glass containers. Paper and cardboard however represent a more complex journey. Although from 1990 we can see a sharp rise in its recycling, this begins to peter out where its trajectory is going downwards, rather than upwards. Despite its initial success, it seems the materials with the more promising recycling outcomes are glass containers and aluminium cans as both lines show an upward direction.
Tip:
Read the news to practice task 1 features. All articles are informed by data or a type of research. Journalists are therefore picking out the most important parts of the data and condensing these for their audience. Similarly, you are identifying the key points in the data presented to you. As well as this, reading news will help to improve your reading skills, grammar, vocabulary and your general English.